GeometryService实现测量功能
几何服务(GeometryService)可以用这个类实现测量直线的距离,形状的缓冲区分析,判断两个形状之间的关系(相交,相离等等),两个形状求交,对形状的裁剪的图形操作。
测量功能的具体代码
1 |
|
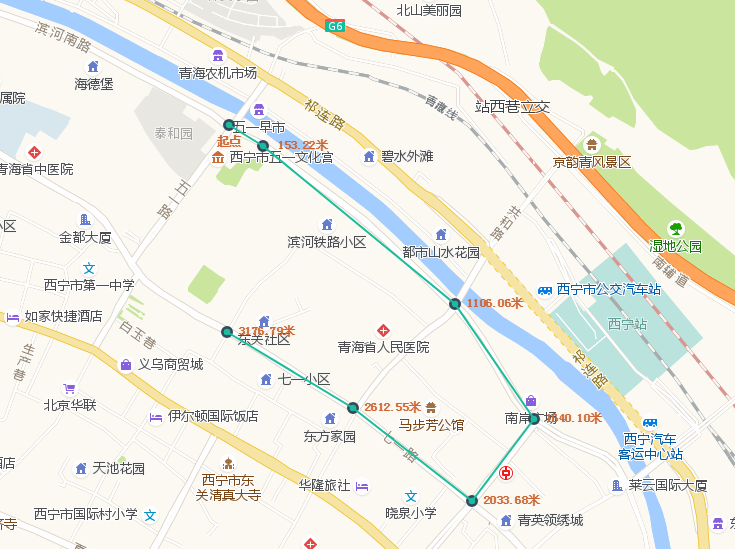
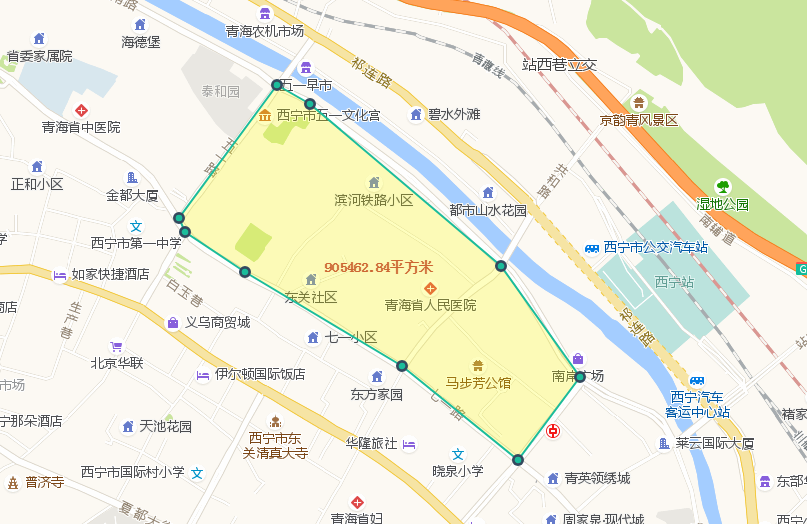
效果图
动态轨迹
原理也就是写一个定时器。一个点动态的沿着线从起点到线的终点。1
2
3
4
5
6
7
8
9
10
11
12
13
14
15
16
17
18
19
20
21
22
23
24
25
26
27
28
29
30
31
32
33
34
35
36
37
38
39
40
41
42
43
44
45
46
47
48
49
50
51
52
53
54
55
56
57
58
59
60
61
62
63
64
65
66
67
68
69
70
71
72
73
74
75
76
77
78
79
80
81
82
83
84
85
86
87
88
89
90
91
92
93
94
95<!DOCTYPE html>
<html lang="en">
<head>
<meta charset="UTF-8">
<title>动态轨迹demo</title>
<link rel="stylesheet" type="text/css" href="http://120.77.215.143:6012/arcgis_js_api/library/3.21/3.21/dijit/themes/tundra/tundra.css"/>
<link rel="stylesheet" type="text/css" href="http://120.77.215.143:6012/arcgis_js_api/library/3.21/3.21/esri/css/esri.css"/>
<script type="text/javascript" src="http://120.77.215.143:6012/arcgis_js_api/library/3.21/3.21/init.js"></script>
<script src="https://cdn.bootcss.com/jquery/3.3.1/jquery.min.js"></script>
</head>
<body>
<div id="map" style="height: 700px;width: 100%;"></div>
<input type="button" id="openTool" value="开启" />
</body>
<script>
require(["esri/map", "extLayers/gaodeLayer","extLayers/TDTLayer",
"esri/geometry/Polyline","esri/symbols/SimpleLineSymbol","esri/graphic","esri/layers/GraphicsLayer",
"esri/geometry/Point","esri/symbols/PictureMarkerSymbol","esri/SpatialReference"
],function (Map,gaodeLayer,TDTLayer,Polyline,SimpleLineSymbol,Graphic,GraphicsLayer,Point,PictureMarkerSymbol,SpatialReference) {
var map=new Map("map",{
center:[112.6,30.5],
zoom:6,
slider:true,
nav:false,
logo:false
});
var gaodelayer=new gaodeLayer();
map.addLayer(gaodelayer);
var graphicsLayer1=new GraphicsLayer();//线图层
map.addLayer(graphicsLayer1);
var graphicsLayer=new GraphicsLayer();//动态点图层
map.addLayer(graphicsLayer);
var path={"point":[[113.68,34.53], [115.58,34.55], [113.57,30.58],[115.53,30.6]]};
var polyline = new Polyline(new SpatialReference({wkid:4326}));
polyline.addPath(path.point);
var sys=new SimpleLineSymbol(SimpleLineSymbol.STYLE_DASH,new esri.Color([0,255,0]),3);
var g=new Graphic(polyline,sys);
graphicsLayer1.add(g);
var point=new Point(path.point[0],new SpatialReference({wkid:4326}));
var picBaseUrl = "https://static.arcgis.com/images/Symbols/Shapes/";
var blue = new PictureMarkerSymbol(picBaseUrl + "BluePin1LargeB.png", 30, 30).setOffset(0, 15);
var graphic=new Graphic(point,blue);
graphicsLayer.add(graphic);
//根据坐标点进行移动
var points,moving;
var startNum,endNum;
document.getElementById("openTool").onclick=function(){
if(typeof(moving)!="undefined"){
clearInterval(moving); //清除移动
}
points = path.point;
graphic.geometry.x = points[0][0];
graphic.geometry.y = points[0][1];
graphicsLayer.redraw();
move(0,1);
};
function move(start,end) {
var x1=points[start][0];
var y1=points[start][1];
var x2=points[end][0];
var y2=points[end][1];
var p=(y2-y1)/(x2-x1);//斜率
var v=0.01; //距离
moving=setInterval(function () {
startNum=start;
endNum=end;
//分别计算 x,y轴方向速度
if(Math.abs(p)==Number.POSITIVE_INFINITY){//p为无穷大
graphic.geometry.y+=v;
}
else {
if (x2<x1){
graphic.geometry.x-=(1/Math.sqrt(1+p*p))*v;
graphic.geometry.y-=(p/Math.sqrt(1+p*p))*v;
}else {
graphic.geometry.x+=(1/Math.sqrt(1+p*p))*v;
graphic.geometry.y+=(p/Math.sqrt(1+p*p))*v;
}
}
graphicsLayer.redraw();
if (Math.abs(graphic.geometry.x - x2) <=0.01 && Math.abs(graphic.geometry.y - y2) <=0.01) {
clearInterval(moving);
startNum=start++;
endNum=end++;
if (end < points.length)
move(start, end);
}
},50);
}
})
</script>
</html>
聚类功能
运用场景:从数据库中读取的点数据量很大或者小区域内点很密集影响展示的两种情况可以采取聚类的方式来得到解决。
从arcgis api官方提供的聚类方法源码中,还不符合我的需求。1.当地图缩放到一定等级之后就不需要聚类了。2.点击聚类点不需要弹窗只需要单机一个点时才弹窗。
所以修改了源码,并添加注释。1
2
3
4
5
6
7
8
9
10
11
12
13
14
15
16
17
18
19
20
21
22
23
24
25
26
27
28
29
30
31
32
33
34
35
36
37
38
39
40
41
42
43
44
45
46
47
48
49
50
51
52
53
54
55
56
57
58
59
60
61
62
63
64
65
66
67
68
69
70
71
72
73
74
75
76
77
78
79
80
81
82
83
84
85
86
87
88
89
90
91
92
93
94
95
96
97
98
99
100
101
102
103
104
105
106
107
108
109
110
111
112
113
114
115
116
117
118
119
120
121
122
123
124
125
126
127
128
129
130
131
132
133
134
135
136
137
138
139
140
141
142
143
144
145
146
147
148
149
150
151
152
153
154
155
156
157
158
159
160
161
162
163
164
165
166
167
168
169
170
171
172
173
174
175
176
177
178
179
180
181
182
183
184
185
186
187
188
189
190
191
192
193
194
195
196
197
198
199
200
201
202
203
204
205
206
207
208
209
210
211
212
213
214
215
216
217
218
219
220
221
222
223
224
225
226
227
228
229
230
231
232
233
234
235
236
237
238
239
240
241
242
243
244
245
246
247
248
249
250
251
252
253
254
255
256
257
258
259
260
261
262
263
264
265
266
267
268
269
270
271
272
273
274
275
276
277
278
279
280
281
282
283
284
285
286
287
288
289
290
291
292
293
294
295
296
297
298
299
300
301
302
303
304
305
306
307
308
309
310
311
312
313
314
315
316
317
318
319
320
321
322
323
324
325
326
327
328
329
330
331
332
333
334
335
336
337
338
339
340
341
342
343
344
345
346
347
348
349
350
351
352
353
354
355
356
357
358
359
360
361
362
363
364
365
366
367
368
369
370
371
372
373
374
375
376
377
378
379
380
381
382
383
384
385define([
"dojo/_base/declare",
"dojo/_base/array",
"esri/Color",
"dojo/_base/connect",
"esri/SpatialReference",
"esri/geometry/Point",
"esri/graphic",
"esri/symbols/SimpleMarkerSymbol",
"esri/symbols/TextSymbol",
"esri/dijit/PopupTemplate",
"esri/layers/GraphicsLayer"
], function (
declare, arrayUtils, Color, connect,
SpatialReference, Point, Graphic, SimpleMarkerSymbol, TextSymbol,
PopupTemplate, GraphicsLayer
) {
return declare([GraphicsLayer], {
constructor: function (options) {
// options:
// data: Object[]
// Array of objects. Required. Object are required to have properties named x, y and attributes. The x and y coordinates have to be numbers that represent a points coordinates.
// distance: Number?
// Optional. The max number of pixels between points to group points in the same cluster. Default value is 50.
// labelColor: String?
// Optional. Hex string or array of rgba values used as the color for cluster labels. Default value is #fff (white).
// labelOffset: String?
// Optional. Number of pixels to shift a cluster label vertically. Defaults to -5 to align labels with circle symbols. Does not work in IE.
// resolution: Number
// Required. Width of a pixel in map coordinates. Example of how to calculate:
// map.extent.getWidth() / map.width
// showSingles: Boolean?
// Optional. Whether or graphics should be displayed when a cluster graphic is clicked. Default is true.
// singleSymbol: MarkerSymbol?
// Marker Symbol (picture or simple). Optional. Symbol to use for graphics that represent single points. Default is a small gray SimpleMarkerSymbol.
// singleTemplate: PopupTemplate?
// PopupTemplate</a>. Optional. Popup template used to format attributes for graphics that represent single points. Default shows all attributes as "attribute = value" (not recommended).
// maxSingles: Number?
// Optional. Threshold for whether or not to show graphics for points in a cluster. Default is 1000.
// webmap: Boolean?
// Optional. Whether or not the map is from an ArcGIS.com webmap. Default is false.
// spatialReference: SpatialReference?
// Optional. Spatial reference for all graphics in the layer. This has to match the spatial reference of the map. Default is 102100. Omit this if the map uses basemaps in web mercator.
this._clusterTolerance = options.distance || 50;
this._clusterData = options.data || [];
this._clusters = [];
this._clusterLabelColor = options.labelColor || "#000";
// labelOffset can be zero so handle it differently
this._clusterLabelOffset = (options.hasOwnProperty("labelOffset")) ? options.labelOffset : -5;
// graphics that represent a single point
this._singles = []; // populated when a graphic is clicked
this._showSingles = options.hasOwnProperty("showSingles") ? options.showSingles : true;
// symbol for single graphics
var SMS = SimpleMarkerSymbol;
this._singleSym = options.singleSymbol || new SMS("circle", 6, null, new Color("#888"));
this._singleTemplate = options.singleTemplate || new PopupTemplate({ "title": "", "description": "{*}" });
this._maxSingles = options.maxSingles || 1000;
this._webmap = options.hasOwnProperty("webmap") ? options.webmap : false;
this._sr = options.spatialReference || new SpatialReference({ "wkid": 102100 });
this._zoomEnd = null;
//新增属性
this._maxZoom = options.maxZoom || 12;
this._map = null;
},
// override esri/layers/GraphicsLayer methods 重写setMap方法
_setMap: function (map, surface) {
// calculate and set the initial resolution 计算和设置初始分辨率
this._clusterResolution = map.extent.getWidth() / map.width; // probably a bad default...
this._map = map;//将map设置为全局变量
this._clusterGraphics();//聚类
// connect to onZoomEnd so data is re-clustered when zoom level changes当缩放级别改变时数据会重新聚集。
this._zoomEnd = connect.connect(map, "onZoomEnd", this, function () {
// update resolution
this._clusterResolution = this._map.extent.getWidth() / this._map.width;
this.clear();//清除
this._clusterGraphics(); //重新聚类
});
// GraphicsLayer will add its own listener here
var div = this.inherited(arguments);
return div;
},
_unsetMap: function () {
this.inherited(arguments);
connect.disconnect(this._zoomEnd);
},
// public ClusterLayer methods
add: function (p) {
// Summary: The argument is a data point to be added to an existing cluster. If the data point falls within an existing cluster, it is added to that cluster and the cluster's label is updated. If the new point does not fall within an existing cluster, a new cluster is created.
//
// if passed a graphic, use the GraphicsLayer's add method
if (p.declaredClass) {
this.inherited(arguments);
return;
}
// add the new data to _clusterData so that it's included in clusters
// when the map level changes
this._clusterData.push(p);
var clustered = false;
// look for an existing cluster for the new point
for (var i = 0; i < this._clusters.length; i++) {
var c = this._clusters[i];
if (this._clusterTest(p, c)) {
// add the point to an existing cluster
this._clusterAddPoint(p, c);
// update the cluster's geometry
this._updateClusterGeometry(c);
// update the label
this._updateLabel(c);
clustered = true;
break;
}
}
if (!clustered) {
this._clusterCreate(p);
p.attributes.clusterCount = 1;
this._showCluster(p);
}
},
clear: function () {
// Summary: Remove all clusters and data points.
this.inherited(arguments);
this._clusters.length = 0;
},
clearSingles: function (singles) {
// Summary: Remove graphics that represent individual data points.
var s = singles || this._singles;
arrayUtils.forEach(s, function (g) {
this.remove(g);
}, this);
this._singles.length = 0;
},
onClick: function (e) {
// remove any previously showing single features
this.clearSingles(this._singles);
// find single graphics that make up the cluster that was clicked
// would be nice to use filter but performance tanks with large arrays in IE
var singles = [];
for (var i = 0, il = this._clusterData.length; i < il; i++) {
if (e.graphic.attributes.clusterId == this._clusterData[i].attributes.clusterId) {
singles.push(this._clusterData[i]);
}
}
//如果聚类点的个数大于0
if (singles.length > this._maxSingles || singles.length > 1) {
// alert("Sorry, that cluster contains more than " + this._maxSingles + " points. Zoom in for more detail.");
var level = this._map.getLevel() + 2 >= 17 ? 17 : this._map.getLevel() + 2;
this._map.setZoom(level);
this._map.centerAt(e.graphic.geometry);
return;
} else {
// stop the click from bubbling to the map
e.stopPropagation(); //阻止map的冒泡事件
this._map.infoWindow.show(e.graphic.geometry);
this._addSingles(singles);
}
},
// internal methods 内部方法
_clusterGraphics: function () {
// first time through, loop through the points 遍历所有数据
for (var j = 0, jl = this._clusterData.length; j < jl; j++) {
// see if the current feature should be added to a cluster
var point = this._clusterData[j];
//状态
var clustered = false;
//遍历聚类数据
for (var i = 0; i < this._clusters.length; i++) {
var c = this._clusters[i];
//如果为true,就push到同一个数组中
if (this._clusterTest(point, c)) {
this._clusterAddPoint(point, c);
clustered = true;
break;
}
}
if (!clustered) {
//如果不为真,将点push到要聚类的数组中
this._clusterCreate(point);
}
}
this._showAllClusters();
},
//判断点是否需要聚类
_clusterTest: function (p, cluster) {
//计算距离
var distance = (
Math.sqrt(
Math.pow((cluster.x - p.x), 2) + Math.pow((cluster.y - p.y), 2)
) / this._clusterResolution
);
var _flag = (distance <= this._clusterTolerance);
var _level = this._map.getZoom();
if (_level >= this._maxZoom) _flag = false;
return _flag;
},
// points passed to clusterAddPoint should be included
// in an existing cluster
// also give the point an attribute called clusterId
// that corresponds to its cluster
//将point加到cluster数组中
_clusterAddPoint: function (p, cluster) {
// average in the new point to the cluster geometry
var count, x, y;
count = cluster.attributes.clusterCount;
//重新计算cluster对象的x,y,总数
x = (p.x + (cluster.x * count)) / (count + 1);
y = (p.y + (cluster.y * count)) / (count + 1);
cluster.x = x;
cluster.y = y;
// build an extent that includes all points in a cluster
// extents are for debug/testing only...not used by the layer
//修改cluster的四至
if (p.x < cluster.attributes.extent[0]) {
cluster.attributes.extent[0] = p.x;
} else if (p.x > cluster.attributes.extent[2]) {
cluster.attributes.extent[2] = p.x;
}
if (p.y < cluster.attributes.extent[1]) {
cluster.attributes.extent[1] = p.y;
} else if (p.y > cluster.attributes.extent[3]) {
cluster.attributes.extent[3] = p.y;
}
// increment the count 增加++
cluster.attributes.clusterCount++;
// 判断对象是否含有指定的属性的
if (!p.hasOwnProperty("attributes")) {
p.attributes = {};
}
// give the graphic a cluster id 将p的clusterId设置为cluster的id
p.attributes.clusterId = cluster.attributes.clusterId;
},
// point passed to clusterCreate isn't within the
// clustering distance specified for the layer so
// create a new cluster for it
//创建cluster对象
_clusterCreate: function (p) {
var clusterId = this._clusters.length + 1;
// p.attributes might be undefined 如果没有定义attributes
if (!p.attributes) {
p.attributes = {};
}
p.attributes.clusterId = clusterId;
// 创建cluster对象
var cluster = {
"x": p.x,
"y": p.y,
"attributes": {
"clusterCount": 1,
"clusterId": clusterId,
"extent": [p.x, p.y, p.x, p.y]
}
};
this._clusters.push(cluster);//push到聚类数组中
},
//显示聚类数组
_showAllClusters: function () {
for (var i = 0, il = this._clusters.length; i < il; i++) {
var c = this._clusters[i];
this._showCluster(c);
}
},
_showCluster: function (c) {
var point = new Point(c.x, c.y, this._sr);
this.add(
new Graphic(
point,
null,
c.attributes
)
);
// code below is used to not label clusters with a single point
//如果聚类数组中的cluster对象的clusterCount为1,就不需要加label
if (c.attributes.clusterCount == 1) {
return;
}
// show number of points in the cluster
//显示聚类点数
var label = new TextSymbol(c.attributes.clusterCount.toString())
.setColor(new Color(this._clusterLabelColor))
.setOffset(0, this._clusterLabelOffset);
this.add(
new Graphic(
point,
label,
c.attributes
)
);
},
_addSingles: function (singles) {
// add single graphics to the map
arrayUtils.forEach(singles, function (p) {
var g = new Graphic(
new Point(p.x, p.y, this._sr),
this._singleSym,
p.attributes,
this._singleTemplate
);
this._singles.push(g);
if (this._showSingles) {
this.add(g);
}
}, this);
this._map.infoWindow.setFeatures(this._singles);
},
//add方法中修改cluster的x,y
_updateClusterGeometry: function (c) {
// find the cluster graphic 根据clusterId在聚类数组中找到这个cluster
var cg = arrayUtils.filter(this.graphics, function (g) {
return !g.symbol &&
g.attributes.clusterId == c.attributes.clusterId;
});
//修改这个cluster的x,y
if (cg.length == 1) {
cg[0].geometry.update(c.x, c.y);
} else {
console.log("在聚类数组中没有找到这个对象: ", cg);
}
},
//add方法中修改cluster的样式
_updateLabel: function (c) {
// find the existing label
var label = arrayUtils.filter(this.graphics, function (g) {
return g.symbol &&
g.symbol.declaredClass == "esri.symbol.TextSymbol" &&
g.attributes.clusterId == c.attributes.clusterId;
});
if (label.length == 1) {
// console.log("update label...found: ", label);
this.remove(label[0]);
var newLabel = new TextSymbol(c.attributes.clusterCount)
.setColor(new Color(this._clusterLabelColor))
.setOffset(0, this._clusterLabelOffset);
this.add(
new Graphic(
new Point(c.x, c.y, this._sr),
newLabel,
c.attributes
)
);
} else {
console.log("在聚类数组中没有找到这个对象: ", label);
}
},
// debug only...never called by the layer
_clusterMeta: function () {
// print total number of features
console.log("Total: ", this._clusterData.length);
// add up counts and print it
var count = 0;
arrayUtils.forEach(this._clusters, function (c) {
count += c.attributes.clusterCount;
});
console.log("In clusters: ", count);
}
});
});
在github上放有具体应用。